The following is a list of productivity shortcuts that are accessed using:
- keyboard shortcuts,
- drag and drop actions that provide automation,
- menu items
- context menus
Tree-view short-cut menus
A range of shortcut menu's can be brought up by dragging tree-view items on top of each other. Shortcut menus are context sensitive, and only valid operations will be displayed.
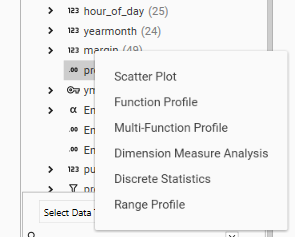
For full details of Tree-view shortcuts, see Database Tree Shortcuts
Drag and drop filtering in grid view
There are 3 ways of working with filters (or subsets of data) in the DataSet view:
- Dragging field values from the DataBase Explorer and dropping into the Query Rule section
- Dragging field values from the DataBase Explorer and dropping directly onto the grid
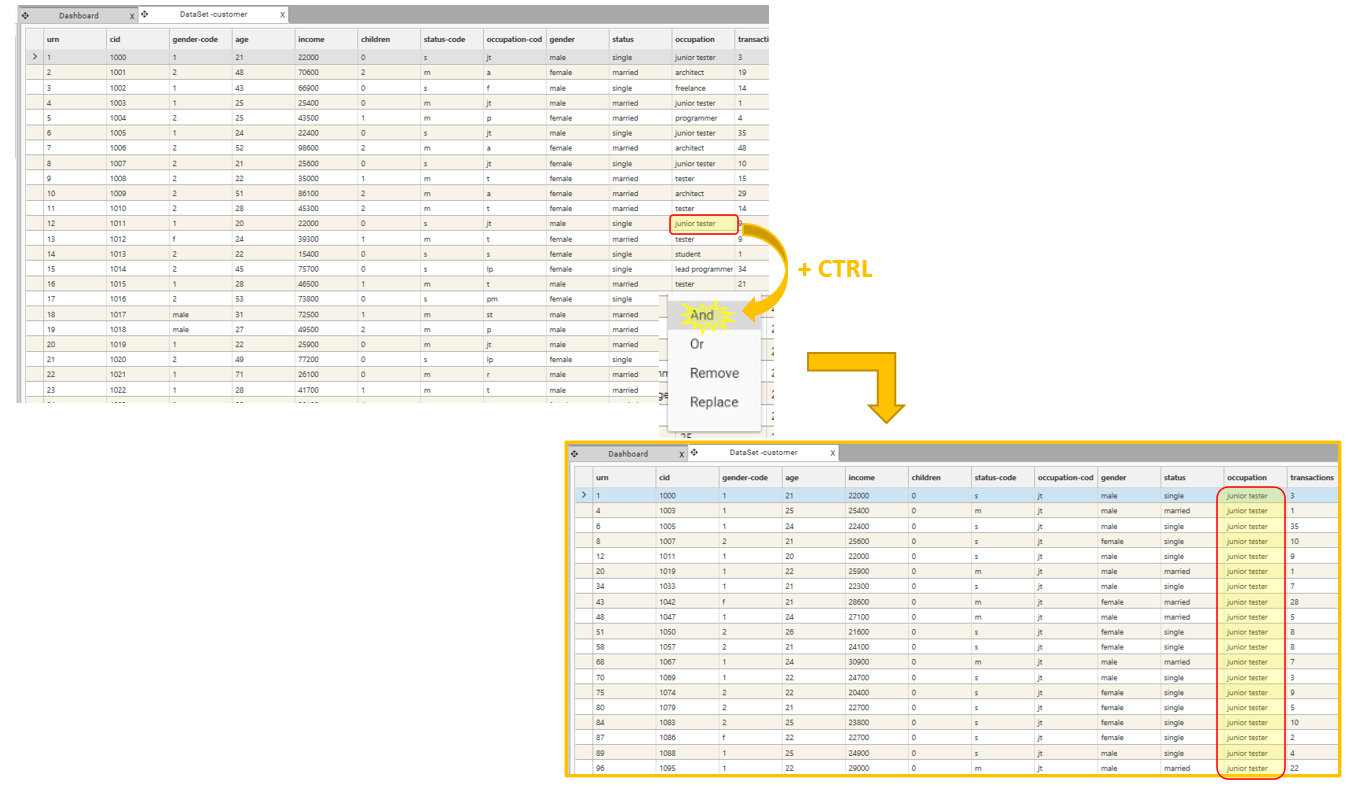
- Selecting a cell in the grid, holding down the CTRL key and dropping the selected cell back onto the grid.
These actions will bring up the DataSet Context menu allowing a filtering method to be selected.
Moving reports within dashboard slots
Existing reports in dashboard slots can be moved from slot to slot by holding down the CTRL key, selecting the slot which is to be moved, and dragging it over the destination slot. This is useful for quickly altering layouts in dashboard.
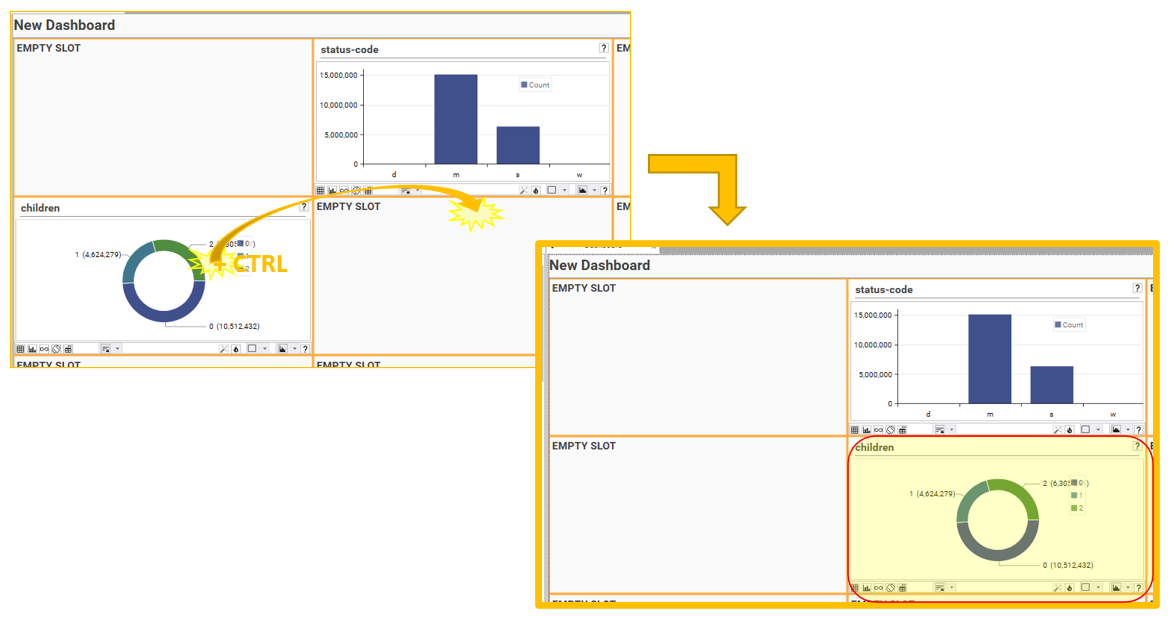
NOTE: Panel reports cannot be moved in this way - to move a panel report, use "Open Copy"
Quick-duplicate in profile reports
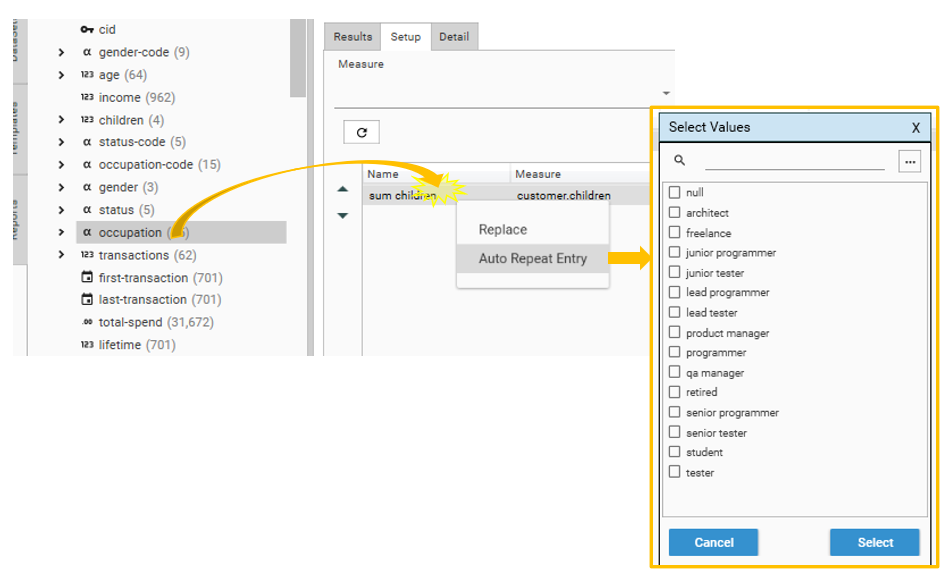
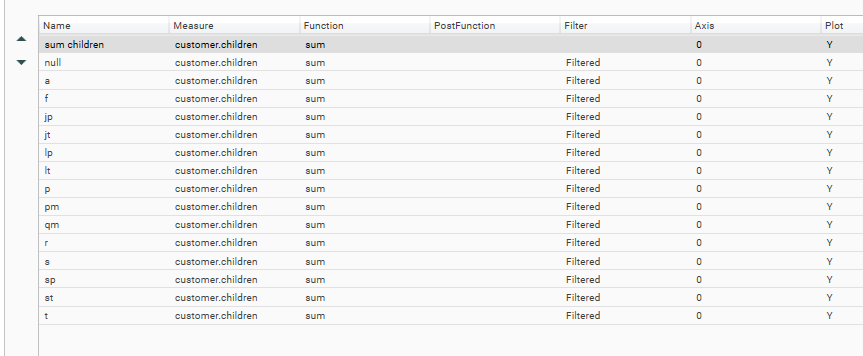
Rapidly duplicate rows in Multi-Function Profiles, where each rows is filtered by a different value from the same field. Choose Auto Repeat Entry, select the values to apply, and duplicate rows will be added as report measures:
View resolved variables in script editor
If using variables in Script Editor (i.e., by using the DEFINES statement), sometimes it is necessary to see the "resolved" script, i.e., with the run-time values of the script in place. There are various ways to review run-time script:
- Run-Time variables window - Script Editor, CTRL L
- View resolved script - Script Editor | File | View Resolved Script
- Method Preview - Script Editor | Right-Click | Preview
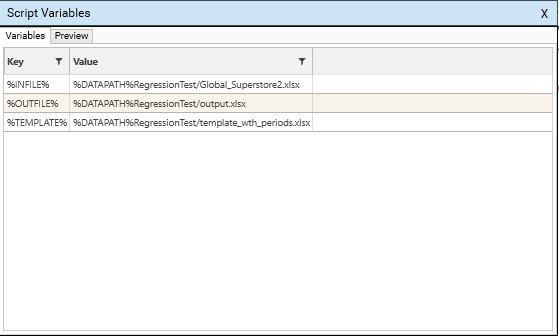 Bring up the run-time script variables window by using CTRL + L
Copy and Paste
The following areas support Copy & Paste including the standard windows CTRL + C, CTRL + V shortcuts:
- Script Editor Method panel (copy and paste single or multiple lines)
- Script Editor JSON panel
- Database Explorer Items (copy only)
- Database Explorer Properties Dialog (copy only)
- Context Panel Counts (copy only)
- Dialog Combo Boxes and Text Boxes (paste only)
In addition to this, the following areas have menu support for copy and/or paste:
- Dashboard Grid displays - copy raw data to clipboard
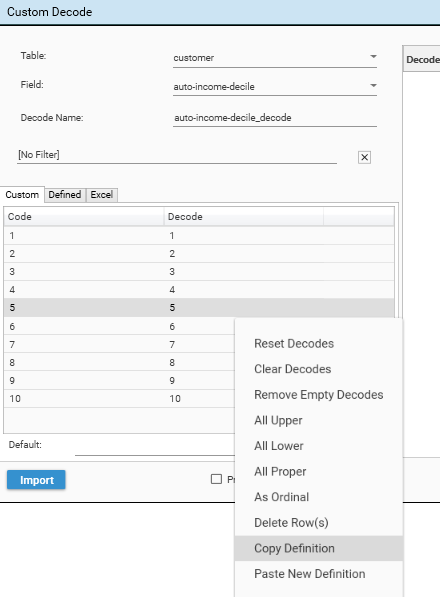
- Decode Dialog - copy definition to clipboard, and paste clipboard back into definition (useful for editing definitions in Excel)
- Banded field dialog - copy definition to clipboard, and paste clipboard back into definition (useful for editing definitions in Excel)
- Cells in the Query Matrix can be copied and pasted.
Navigation
- When in Database List or Category view, clicking on the Database tab will go back to the Tree View. (Note: this is in addition to the Tree-View icon in the Database Explorer).
- When in Database Tree-View, right-click an object and select Open In List to see the item in the List View.
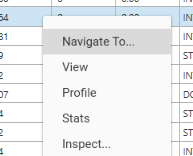
- When in Data Audit, right-click a field and choose "Navigate To" to select the field in the active Database view
- Drag a field from the Database Explorer and drop on the Data Audit report to highlight the selected field.
Connecting Reports
Split View Drag and Drop
Easily drag datasets from one report to another by selecting "Split" from the tab header of one of the report. This will put two reports side by side in the Workspace window, allowing segments to be selected from one report and dropped on another in one movement. (Select the right-hand tab and choose "Split Left" to go back to single-tab view)

Connected Reports
Use connected reports to connect one profile to another - the dataset connected in the left-hand report will be automatically applied as filter in the right-hand report (if auto-calculate is turned on)
Drag and Drop to Entity Selector
When performing cross-table drag and drop operations (such as creating joins, calculating aggregates, copying fields etc), sometimes the table layout makes it difficult to move directly from source to target. In these instances, use the Database Explorer | New Selector button...
...to bring up the floating Entity Selector:

Drag and drop items between the Database Explorer and the Entity Selector.
Floating Windows
Any Workspace tab can be turned into a floating window by right-clicking the tab header and choosing "Float".
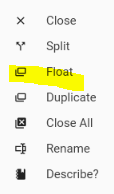
This allows side by side comparison of grids and charts, as well as facilitating drag and drop from one report to another.
Copy & Paste from Decode or Banding to Excel
The Decode dialog and Banding dialog both support copy and paste. Use this to copy a complex definition into and out of other applications that provide extended editing features:
Create definition file from Import Wizard
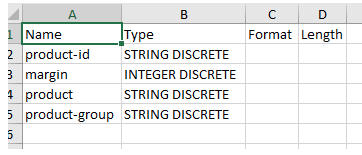
Quickly create a template definition file for loading data from the Delimited File Importer. Use the wizard to select a sample source file, auto-guess data types (Delimited File Importer | Tools | Auto-guess Data types) and then use Delimited File Importer | Tools | Create Definition File to output the wizard definition to Excel:
Quick Check cross-table join counts
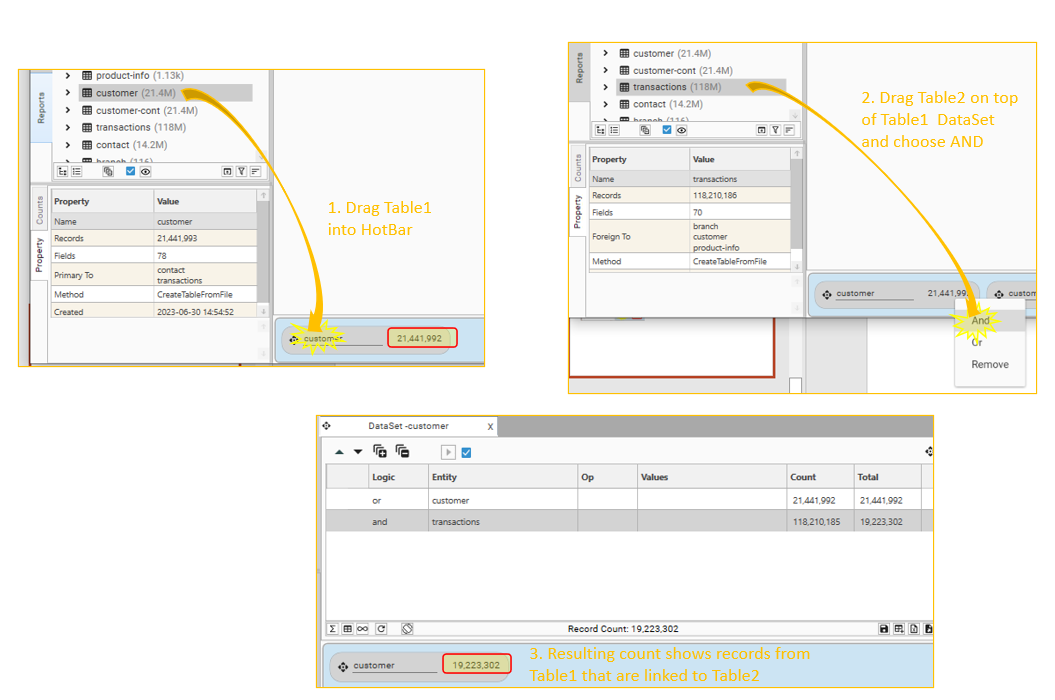
To quickly verify the links between tables, drag Datasets into the DataSet Hotbar and use DataSet manipulation:
- Drag Table1 into HotBar
- Drag Table2 and drop on top of Table1_Dataset in the Hotbar
- The DataSet number is the number of Table1 records that are linked to Table2
Duplicating Tabs
Workspace tabs can be duplicated by right-clicking on the Tab Header and choosing "Duplicate". This allows a copy of a report to be quickly made, and is especially useful when designing dashboards and more complex reports.
Quick Drop segments onto Venn
Drop segments onto the Venn report without bringing up the naming dialog by holding down the left ctrl key when dropping a segment:
The "name for Dataset" dialog will not be displayed if the ctrl-left key is pressed:
