as%i
Multiples current row by 100 and displays as an integer
Purpose
Use this function to:
- Quickly format a result to display as a percentage
Calculation
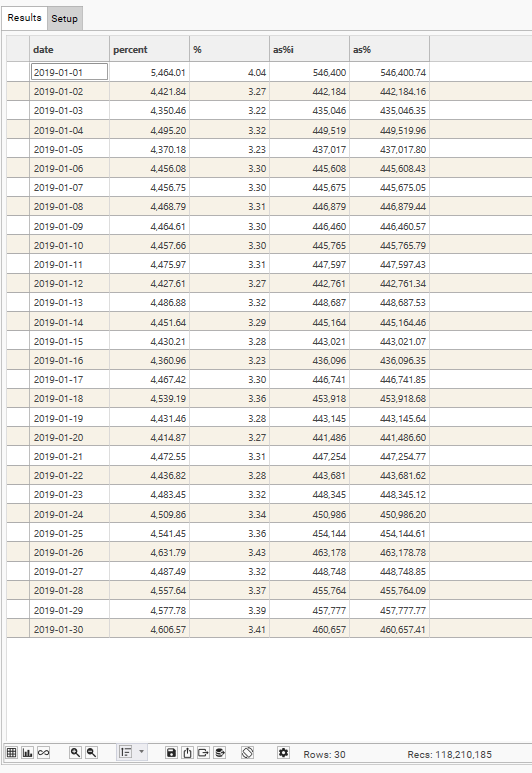
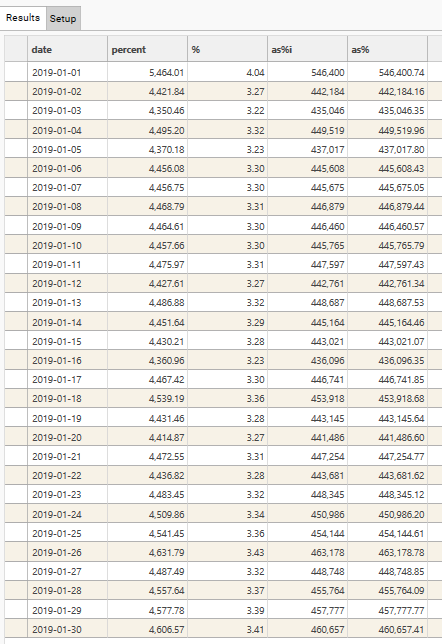
If current row = 0.34, returns 34
Sample
Parameters
| Parameter | Description |
|---|---|
| Dimensions | Discrete field(s). All fields must come from the same table. |
| Name | Name to be displayed as Column Header in result grid |
| Measure | The field to be used in the post-function calculation.
|
| Function | COUNT / SUM / AVG / MIN / MAX / STDEV |
| Post | as%i |
| Value | Optional. Filter to apply when evaluating FUNCTION. Only records in the Filter Recordset will be included in the Function and Post-Function calculations. Must come from same table as DIMENSION/MEASURE or be linked to the Dimension table. |
| Axis | 0 / 1. Y-Axis to use when plotting graph. Default = 0 |
| Plot | Y / N. Specifies whether measure’s output column should be plotted on graph. Default = Y |
| Resolve | Optional. Resolve level for the measure. If blank, Resolve = Dimension Table |
| Series Type | Default / Bar / Stacked Bar / Line / Spline / RangeLow / RangeHigh / CSLow / CSHigh / CSOpen / CSClose Determines the graph style for the measure. |
| Popup | Default / None / Extended |
| Prefix | $ / £ / E / % |
Example
Example use: Expressing a value as an integer percentage. Differences between %,as% and as%i
If a profile report is being used to display a value that is a percentage, the display can be modified using as%i so that the data reads more easily to the end user
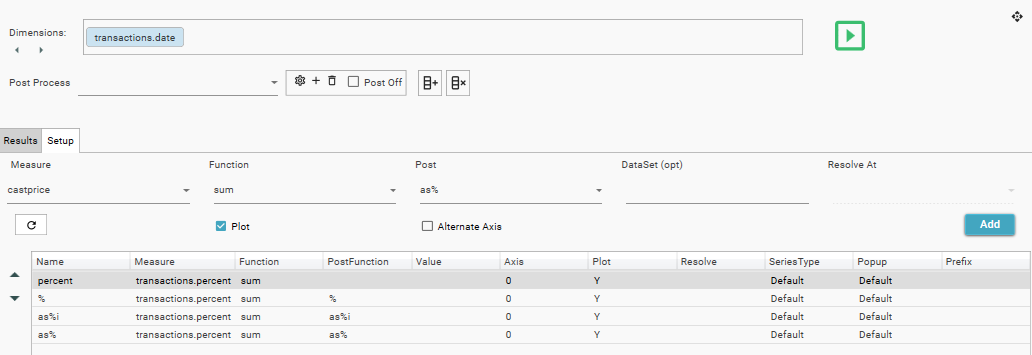
Dimension: [transactions].[date]
Measure 1
| Measure 2
|
Measure 3
| Measure 4
|