2dseq
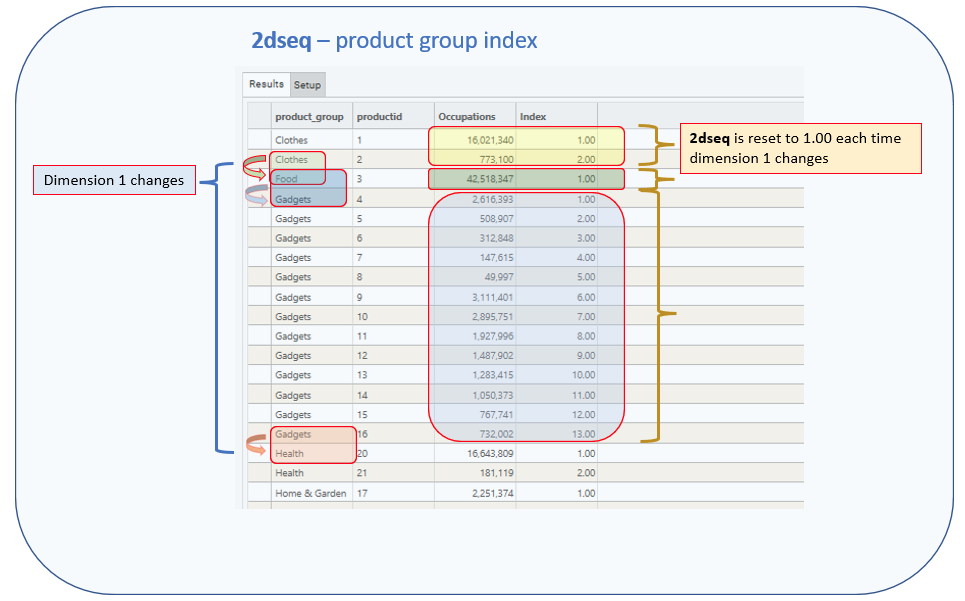
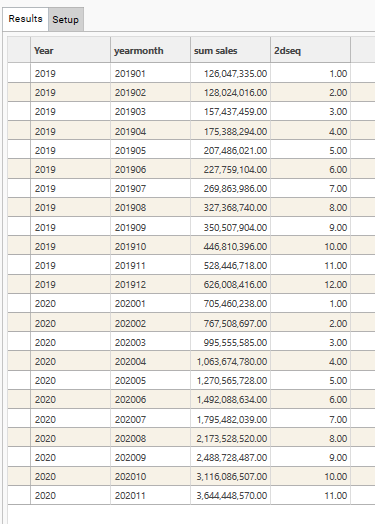
Returns an increment of the number of rows since dimension 1 changed
Requires 2 dimensions (2d) (Otherwise will always return 1.00)
Increments each row (seq)
Purpose
Use this function to:
- Index items within subgroups
Sample Result
Parameters
| Parameter | Description |
|---|---|
| Dimensions | Discrete field(s). All fields must come from the same table. |
| Name | Name to be displayed as Column Header in result grid |
| Measure | The field to be used in the post-function calculation.
|
| Function | COUNT / SUM / AVG / MIN / MAX / STDEV |
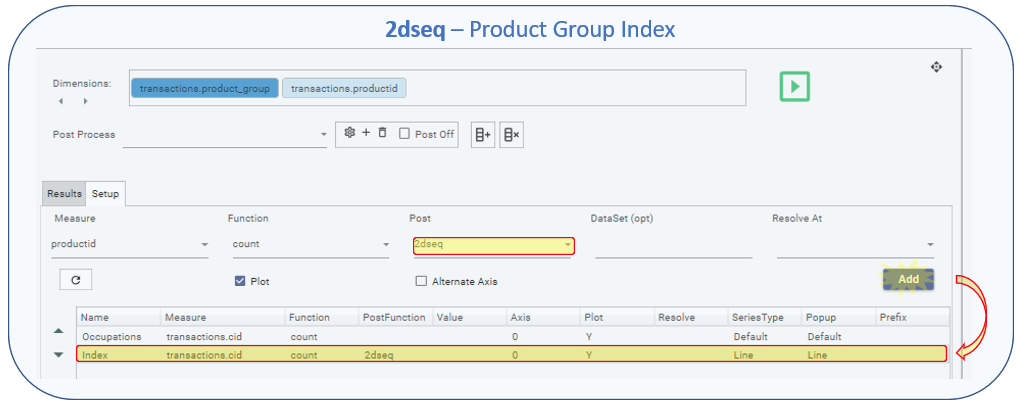
| Post | 2dseq |
| Value | Optional. Filter to apply when evaluating FUNCTION. Only records in the Filter Recordset will be included in the Function and Post-Function calculations. Must come from same table as DIMENSION/MEASURE or be linked to the Dimension table. |
| Axis | 0 / 1. Y-Axis to use when plotting graph. Default = 0 |
| Plot | Y / N. Specifies whether measure’s output column should be plotted on graph. Default = Y |
| Resolve | Optional. Resolve level for the measure. If blank, Resolve = Dimension Table |
| Series Type | Default / Bar / Stacked Bar / Line / Spline / RangeLow / RangeHigh / CSLow / CSHigh / CSOpen / CSClose Determines the graph style for the measure. |
| Popup | Default / None / Extended |
| Prefix | $ / £ / E / % |
Usage Notes
Returns a decimal.
Example
NOTE: Measure 1 is included purely for illustration. It is not necessary to include this measure for the calculation to work.
Example use: Give each product within a product group an index
Dimension:[transactions].[product_group], [transactions].[product_ID]
Measure 1
| Measure 2
|